*ELK5 Stack
Elasticsearch 5.0.0 안정화 버전이 2016년 11월자로 릴리스 되었다. 기존 버전에 비하여 인덱싱 성능이 25~80% 정도 개선 되었으며
새로운 자료 구조를 제공 하고 있다고 한다 또한, es5 릴리스와 함께 kibana,logstash,filebeat 도 동일하게 5 버전으로 릴리스 되었다.
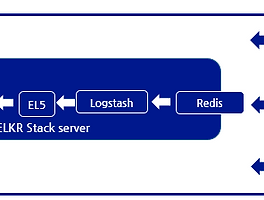
* Stack 구성

Stack 구성은 기존 es2 버전과 동일하게 되어있는 구조로 되어 있다.
1)Logstash: 로그를 받아서 해당 로그를 elasticsearch 로 전달 하는 역할 을 한다.
2)Elasticsearch : 로그를 저장, 검색 인덱싱 하는 과정을 한다.
3)Kibana: nginx proxy 를 통하여 전달되는 웹인터페이스로 각 로그를 유저가 볼 수 있게 가시화 하는 역할을 한다.
4)Filebeat:각각의 target 이되는 서버는 로그를 filebeat 를 이용하여 logstash 에 로그를 보낸다. 로그를 전달하는 agent 역할을 한다
*설피 필요 패키지 다운 로그 및 시간 동기화
본격적인 설치 과정에 앞서, 설치에 필요한 패키지 및 시간 동기화를 진행 한다.
[root@localhost ~]# yum install wget rdate unzipepel-release epel* -y && rdate -s time.bora.net
* Install Java 8
Elasticsearch, Logstash 는 java 기반으로 동작 하기 때문에 openJDK 를 이용하여 설치한다.
[root@localhost ~]# cd ~ && wget --no-cookies --no-check-certificate --header "Cookie: gpw_e24=http%3A%2F%2Fwww.oracle.com%2F; oraclelicense=accept-securebackup-cookie" "http://download.oracle.com/otn-pub/java/jdk/8u73-b02/jdk-8u73-linux-x64.rpm"
[root@localhost ~]# yum -y localinstall jdk-8u73-linux-x64.rpm && rm -rf ~/jdk-8u*-linux-x64.rpm && java -version
java version "1.8.0_73"
* Install es5
Elasticsearch5 패키지 저장소를 등록후 Elasticsearch5를 설치 한다. 하위 버전과 다르게 해당 repo 등록시
kibana,logstash 등도 동일한 버전으로 설치 가능 하게 제공 된다.
[root@localhost ~]# rpm --import http://packages.elastic.co/GPG-KEY-elasticsearch
[root@localhost ~]# echo '[elasticsearch-5.x]
name=Elasticsearch repository for 5.x packages
baseurl=https://artifacts.elastic.co/packages/5.x/yum
gpgcheck=1
gpgkey=https://artifacts.elastic.co/GPG-KEY-elasticsearch
enabled=1
autorefresh=1
type=rpm-md' | sudo tee /etc/yum.repos.d/elasticsearch.repo
[root@localhost ~]# vi /etc/elasticsearch/elasticsearch.yml
54 # network.host: 192.168.0.1
55 network.host: localhost
[root@localhost ~]# systemctl start elasticsearch && systemctl enable elasticsearch
[root@localhost ~]# curl http://localhost:9200
{
"name" : "ecJIf0x",
"cluster_name" : "elasticsearch",
"cluster_uuid" : "scfl5q7HQuGmfiZc-fvsRA",
"version" : {
"number" : "5.1.1",
"build_hash" : "5395e21",
"build_date" : "2016-12-06T12:36:15.409Z",
"build_snapshot" : false,
"lucene_version" : "6.3.0"
},
"tagline" : "You Know, for Search"
}
* Install kibana5
es5 설치전 등록된 repo 를 이용하여 , kibana5 를 설치 한다.
[root@localhost ~]# yum -y install kibana
[root@localhost ~]# vi /etc/kibana/kibana.yml
5 # server.host: "0.0.0.0"
6 server.host: localhost
[root@localhost ~]# systemctl start kibana && systemctl enable kibana
* Install nginx
kibana 는 별도의 인증이 없기 때문에 nginx proxy 를 통하여 nginx 로 접근 하며, nginx 의 웹 인증을 이용하여 프록시 설정을 아래와 같이 진행 한다.
[root@localhost ~]# yum -y install nginx httpd-tools
[root@localhost ~]# htpasswd -c /etc/nginx/htpasswd.users admin
New password:
Re-type new password:
Adding password for user admin
[root@localhost ~]# vi /etc/nginx/nginx.conf
server {
listen 80 default_server;
listen [::]:80 default_server;
server_name _;
root /usr/share/nginx/html;
location / {
auth_basic "Restricted Access";
auth_basic_user_file /etc/nginx/htpasswd.users;
proxy_set_header X-Forwarded-Host $host;
proxy_set_header X-Forwarded-Server $host;
proxy_set_header X-Forwarded-For $proxy_add_x_forwarded_for;
proxy_pass http://localhost:5601;
}
[root@localhost ~]# systemctl start nginx && systemctl enable nginx
* Install logstash5
logstash도 동일하게 설정된 es5 repo 를 이용하여, logstash5 를 yum 으로 설치 한다.
[root@localhost ~]# yum list | grep logstash
logstash.noarch 1:5.1.1-1 elasticsearch-5.x
[root@localhost ~]# yum install logstash
* Configure Logstash
[root@localhost tls]# vi /etc/logstash/conf.d/10-syslog-filter.conf
input {
beats {
port => 5044
}
}
filter {
if [type] == "syslog" {
grok {
match => [ "message", "%{SYSLOGTIMESTAMP:syslog_timestamp}%{SPACE}%{WORD:syslog_hostname}%{SPACE}%{DATA:syslog_program}\:%{SPACE}%{GRE
EDYDATA:syslog_message}" ]
add_field => [ "received_at", "%{@timestamp}" ]
add_field => [ "received_from", "%{host}" ]
}
syslog_pri { }
}
}
output {
elasticsearch {
hosts => "localhost:9200"
}
}
모든 설정이 끝나면 아래와 같이 logstash 를 재시작 한다.
[root@localhost tls]# systemctl restart logstash && systemctl enable logstash
*filebeat install ,configuration
해당 데모 에서는 ELK 서버 자체의 syslog 를 수집 하기 위해 ELK 서버 자체에 filebeat 를 설치 하여, 로그를 전송 하게 한다.
[root@localhost tls]# yum -y install filebeat
[root@localhost tls]# vi /etc/filebeat/filebeat.yml
filebeat:
# List of prospectors to fetch data.
prospectors:
# Each - is a prospector. Below are the prospector specific configurations
-
# Paths that should be crawled and fetched. Glob based paths.
# To fetch all ".log" files from a specific level of subdirectories
# /var/log/*/*.log can be used.
# For each file found under this path, a harvester is started.
# Make sure not file is defined twice as this can lead to unexpected behaviour.
paths:
- /var/log/messages
document_type: syslog
...생략...
#----------------------------- Logstash output --------------------------------
output.logstash:
# The Logstash hosts
hosts: ["localhost:5044"]
[root@localhost tls]# systemctl restart filebeat
*kibana setting
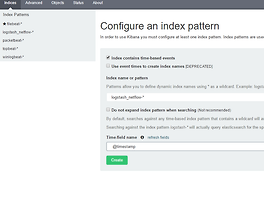
웹 브라우저를 통하여 kibana 를 접속 하면 처음 접속시 index pattern 이 등록 된것이 없기 때문에 아래와 같이 index pattern
설정 부분으로 들어 온다. index 는 logstash* 로 설정 후 생성 한다.
(이미지 잘못 나와 있습니다. filebeat 가 아닌 logstash 입니다.)

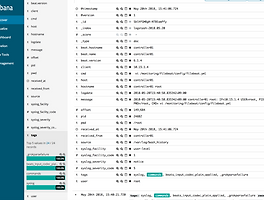
정상적으로 될 경우 아래와 같이 필드를 확인 할 수 있다.

Discovery 를 통하여 로그를 확인 할 수 있다.
기본적인 메뉴는 하위 버전과 유사 하며, 설정 방법도 동일하다.

2016년 상반기 부터 사용이 중지 되었던 지도 기반 visualize 도 정상적으로 등록 되는 것을 확인 할 수 있다.

또한, Timelion 도 기본 내장 되어 있다.

*Xpack install
추가적인 기능을 제공하는 xpack 설치(무료 평가판 으로 유료 패키지임)
[root@201 ~]# cd /tmp && wget https://artifacts.elastic.co/downloads/packs/x-pack/x-pack-5.1.1.zip
[root@201 ~]# /usr/share/elasticsearch/bin/elasticsearch-plugin install file:///tmp/x-pack-5.1.1.zip
[root@201 ~]# /usr/share/kibana/bin/kibana-plugin install file:///tmp/x-pack-5.1.1.zip
[root@localhost ~]# vi /etc/elasticsearch/elasticsearch.yml
##로그인 페이지 보여주지 않음
xpack.security.enabled: false
[root@201 tmp]# systemctl restart elasticsearch
[root@201 tmp]# systemctl restart kibana
아래 이미지처럼 왼쪽에 추가적인 메뉴가 생긴 것을 확인 할 수 있다.
자세한 내용은 홈페이지 참조 한다.

반응형
'System > Elastic Stack' 카테고리의 다른 글
| Logging every shell command to elastic stack (0) | 2018.05.20 |
|---|---|
| Elasticsearch5, Logstash5, Kibana5 and Redis (ELKR5 Stack) install CentOS 7 (0) | 2016.12.24 |
| netflow 데이터를 이용한 elk 설정 (3) | 2016.12.19 |
| logstash 패턴을 이용한 ELK 파싱(nginx access log,nginx access log + geoip) (0) | 2016.12.14 |
| Elasticsearch, Logstash, and Kibana (ELK Stack) install CentOS 7 (0) | 2016.12.14 |