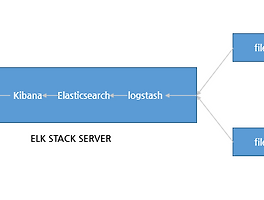
* Stack 구성

1)Logstash: 로그를 받아서 해당 로그를 elasticsearch 로 전달 하는 역할 을 한다.
2)Elasticsearch : 로그를 저장, 검색 인덱싱 하는 과정을 한다.
3)Kibana: nginx proxy 를 통하여 전달되는 웹인터페이스로 각 로그를 유저가 볼 수 있게 가시화 하는 역할을 한다.
4)Filebeat:각각의 target 이되는 서버는 로그를 filebeat 를 이용하여 logstash 에 로그를 보낸다. 로그를 전달하는 agent 역할을 한다
* Prerequisites
각 서버의 사양은 아래와 같으며, VM 환경으로 진행 되었다.
OS:Centos7.2 64bit
MEMORY : 4G
CPU : L5630 @ 2.13GHz *2cpu
ELK STACK SERVER IP : 1.234.42.101
ELK STACK TARGET IP : 1.234.42.102
* rdate,wget install
[root@localhost ~]# yum install wget rdate unzip -y
[root@localhost ~]# rdate -s time.bora.net
[root@localhost ~]# yum -y install epel-release
* Install Java 8
Elasticsearch, Logstash 는 java 기반으로 동작 하기 때문에 openJDK 를 이용하여 설치한다.
[root@localhost ~]# cd ~
[root@localhost ~]# wget --no-cookies --no-check-certificate --header "Cookie: gpw_e24=http%3A%2F%2Fwww.oracle.com%2F; oraclelicense=accept-securebackup-cookie" "http://download.oracle.com/otn-pub/java/jdk/8u73-b02/jdk-8u73-linux-x64.rpm"
[root@localhost ~]# yum -y localinstall jdk-8u73-linux-x64.rpm && rm -rf ~/jdk-8u*-linux-x64.rpm
[root@localhost ~]# java -version
java version "1.8.0_73"
* Install Elasticsearch
Elasticsearch 패키지 저장소를 등록후 Elasticsearch를 설치 한다.
[root@localhost ~]# rpm --import http://packages.elastic.co/GPG-KEY-elasticsearch
[root@localhost ~]# echo '[elasticsearch-2.x]
name=Elasticsearch repository for 2.x packages
baseurl=http://packages.elastic.co/elasticsearch/2.x/centos
gpgcheck=1
gpgkey=http://packages.elastic.co/GPG-KEY-elasticsearch
enabled=1
' | sudo tee /etc/yum.repos.d/elasticsearch.repo
[root@localhost ~]# yum -y install elasticsearch
elasticsearch.yml 파일을 수정하여, elasticsearch가 binding 될 아이피를 설정 한다.
해당 과정에서는 별도의 cluster 없이 진행 하기 때문에 locashot 로 설정 한다.
[root@localhost ~]# vi /etc/elasticsearch/elasticsearch.yml
54 # network.host: 192.168.0.1
55 network.host: localhost
elasticsearch를 재시작, listening 되어 있는 상태를 확인 한다.
[root@localhost ~]# systemctl start elasticsearch
[root@localhost ~]# systemctl enable elasticsearch
[root@localhost ~]# netstat -nltp | grep 9200
[root@localhost ~]# netstat -nltp | grep 9200
tcp6 0 0 ::1:9200 :::* LISTEN 49665/java
tcp6 0 0 127.0.0.1:9200 :::* LISTEN 49665/java
* Install Kibana
kibana도 패키지 저장소 등록후, 설치 진행 한다.
[root@localhost ~]# echo '[kibana-4.4]
name=Kibana repository for 4.4.x packages
baseurl=http://packages.elastic.co/kibana/4.4/centos
gpgcheck=1
gpgkey=http://packages.elastic.co/GPG-KEY-elasticsearch
enabled=1
' | sudo tee /etc/yum.repos.d/kibana.repo
[root@localhost ~]# yum -y install kibana
바인딩 될 아이피를 설정 한다. nginx proxy 를 통하여 웹 인증을 하기 때문에 별도의 외부 아이피가 아닌 localhost 로 등록 한다.
[root@localhost ~]# vi /opt/kibana/config/kibana.yml
5 # server.host: "0.0.0.0"
6 server.host: localhost
kibana 를 시작한다.
[root@localhost ~]# systemctl start kibana
[root@localhost ~]# systemctl enable kibana
* Install Nginx
kibana 는 별도의 인증이 없기 때문에 nginx proxy 를 통하여 nginx 로 접근 하며, nginx 의 웹 인증을 이용하여 프록시 설정을 아래와 같이 진행 한다.
[root@localhost ~]# yum -y install nginx httpd-tools
[root@localhost ~]# htpasswd -c /etc/nginx/htpasswd.users admin
New password:
Re-type new password:
Adding password for user admin
[root@localhost ~]# vi /etc/nginx/nginx.conf
server {
listen 80 default_server;
listen [::]:80 default_server;
server_name _;
root /usr/share/nginx/html;
location / {
auth_basic "Restricted Access";
auth_basic_user_file /etc/nginx/htpasswd.users;
proxy_set_header X-Forwarded-Host $host;
proxy_set_header X-Forwarded-Server $host;
proxy_set_header X-Forwarded-For $proxy_add_x_forwarded_for;
proxy_pass http://localhost:5601;
}
nginx 를 실행 하면 서버에서 listening 되어 있는 상태는 아래와 같은 상태가 된다.
[root@localhost ~]# systemctl start nginx
[root@localhost ~]# systemctl enable nginx
[root@localhost ~]# netstat -ntlp
Active Internet connections (only servers)
Proto Recv-Q Send-Q Local Address Foreign Address State PID/Program name
tcp 0 0 127.0.0.1:5601 0.0.0.0:* LISTEN 49813/node
tcp 0 0 0.0.0.0:80 0.0.0.0:* LISTEN 49996/nginx: master
tcp 0 0 0.0.0.0:22 0.0.0.0:* LISTEN 23212/sshd
tcp 0 0 127.0.0.1:25 0.0.0.0:* LISTEN 2388/master
tcp6 0 0 :::80 :::* LISTEN 49996/nginx: master
tcp6 0 0 ::1:9200 :::* LISTEN 49665/java
tcp6 0 0 127.0.0.1:9200 :::* LISTEN 49665/java
tcp6 0 0 ::1:9300 :::* LISTEN 49665/java
tcp6 0 0 127.0.0.1:9300 :::* LISTEN 49665/java
tcp6 0 0 :::22 :::* LISTEN 23212/sshd
tcp6 0 0 ::1:25 :::* LISTEN 2388/master
* Install Logstash
logstash 도 전과 동일하기 패키지 저장소를 등록, 설치 한다.
설정은 ssl 생성후 설정 한다.
[root@localhost ~]# echo '[logstash-2.2]
name=logstash repository for 2.2 packages
baseurl=http://packages.elasticsearch.org/logstash/2.2/centos
gpgcheck=1
gpgkey=http://packages.elasticsearch.org/GPG-KEY-elasticsearch
enabled=1
' | sudo tee /etc/yum.repos.d/logstash.repo
[root@localhost ~]# yum -y install logstash
* Generate SSL Certificates
각 target 이 되는 서버들은 filebeat 를 통하여 로그를 전달 한다. 이때 인증서는 각 서버의 id를 확인 하는데 사용 되며
쌍으로 만들어 인증 하게 된다.
openssl.cnf 파일을 열어서 v3_ca 지시자에 elk server 의 아이피를 추가 한다.
이때 target 이 되는 서버들은 해당 인증서의 아이피를 보고 전달 하기 때문에 서로 통신이 되는 아이피로 수정 해야 한다.
[root@localhost ~]# vi /etc/pki/tls/openssl.cnf
226 [ v3_ca ]
227 subjectAltName = IP:1.234.42.101
openssl을 이용하여crt 파일을 생성 하며 해당 crt 파일을 쌍으로 관리 인증 하게 된다.
이때, 각 서버들간의 시간이 맞지 않으면 인증서의 시간이 맞지 않아 인증이 안되는 오류가 발생이 되기 때문에
시간 동기화를 미리 하는 것이 좋다.
[root@localhost tls]# cd /etc/pki/tls
[root@localhost tls]# sudo openssl req -config /etc/pki/tls/openssl.cnf -x509 -days 3650 -batch -nodes -newkey rsa:2048 -keyout private/logstash-forwarder.key -out certs/logstash-forwarder.crt
Generating a 2048 bit RSA private key
................................................................+++
....................+++
writing new private key to 'private/logstash-forwarder.key'
-----
* Configure Logstash
logstash 설정을 위해 /etc/logstash/conf.d/ 디렉토리에 02-beats-input.conf파일을 생성 아래와 같이 수정 한다.
이때, 5044포트로 사용할 인증서와 key를 추가 하여, 해당 인증으로만 들어오는 로그를 input 으로 받겠다는 의미이다.
[root@localhost tls]# vi /etc/logstash/conf.d/02-beats-input.conf
input {
beats {
port => 5044
ssl => true
ssl_certificate => "/etc/pki/tls/certs/logstash-forwarder.crt"
ssl_key => "/etc/pki/tls/private/logstash-forwarder.key"
}
}
10-syslog-filter.conf 파일을 추가 하여 로그로 전달된 타입이 syslog 로 되어 있는 경우 grok 패턴으로 메세지를 파싱 한다.
자세한 grok 파싱 부분은 추후 확인 한다.
[root@localhost tls]# vi /etc/logstash/conf.d/10-syslog-filter.conf
filter {
if [type] == "syslog" {
grok {
match => { "message" => "%{SYSLOGTIMESTAMP:syslog_timestamp} %{SYSLOGHOST:syslog_hostname} %{DATA:syslog_program}(?:\[%{POSINT:syslog_pid}\])
?: %{GREEDYDATA:syslog_message}" }
add_field => [ "received_at", "%{@timestamp}" ]
add_field => [ "received_from", "%{host}" ]
}
syslog_pri { }
date {
match => [ "syslog_timestamp", "MMM d HH:mm:ss", "MMM dd HH:mm:ss" ]
}
}
}
filter 된 log를 localhost 9200 포트를 사용 하는 elasticsearch 로 output 전달하는 설정 파일을 수정산다.
[root@localhost tls]# vi /etc/logstash/conf.d/30-elasticsearch-output.conf
output {
elasticsearch {
hosts => ["localhost:9200"]
sniffing => true
manage_template => false
index => "%{[@metadata][beat]}-%{+YYYY.MM.dd}"
document_type => "%{[@metadata][type]}"
}
}
모든 설정이 끝나면 아래와 같이 logstash 를 재시작 한다.
[root@localhost tls]# systemctl restart logstash
[root@localhost tls]# chkconfig logstash on
* Load Kibana Dashboards
Elastic은 kibana 에서 사용할수 있는 샘플 dashboard 와 beats 패턴을 제공한다 해당 샘플 dashboard 와 패턴을 다운로후 load한다.
[root@localhost tls]# cd ~
[root@localhost ~]# curl -L -O https://download.elastic.co/beats/dashboards/beats-dashboards-1.1.0.zip
[root@localhost ~]# unzip beats-dashboards-*.zip
[root@localhost ~]# cd beats-dashboards-*
[root@localhost beats-dashboards-1.1.0]# ./load.sh
Loading dashboards to http://localhost:9200 in .kibana
Loading search Cache-transactions:
{"_index":".kibana","_type":"search","_id":"Cache-transactions","_version":1,"_shards":{"total":2,"successful":1,"failed":0},"created":true}
Loading search DB-transactions:
{"_index":".kibana","_type":"search","_id":"DB-transactions","_version":1,"_shards":{"total":2,"successful":1,"failed":0},"created":true}
Loading search Default-Search:
{"_index":".kibana","_type":"search","_id":"Default-Search","_version":1,"_shards":{"total":2,"successful":1,"failed":0},"created":true}
Loading search Errors:
{"_index":".kibana","_type":"search","_id":"Errors","_version":1,"_shards":{"total":2,"successful":1,"failed":0},"created":true}
Loading search Filesystem-stats:
...생략....
* Load Filebeat Index Template in Elasticsearch
elasticsearch 에서 filebeat 템플릿을 로드 테스트 진행 한다.
[root@localhost ~]# curl -O https://gist.githubusercontent.com/thisismitch/3429023e8438cc25b86c/raw/d8c479e2a1adcea8b1fe86570e42abab0f10f364/filebeat-index-template.json
[root@localhost ~]# curl -XPUT 'http://localhost:9200/_template/filebeat?pretty' -d@filebeat-index-template.json
{
"acknowledged" : true
}
* Set Up Filebeat (Add Client Servers)
target 이되는 서버에서 elk 로 로그를 보내기 위해 인증서를 elk 서버 에서 scp를 이용하여 전송한다.
[root@localhost ~]# scp /etc/pki/tls/certs/logstash-forwarder.crt root@1.234.42.102:/tmp
root@1.234.42.102's password:
logstash-forwarder.crt
클라이언트 서버에서 crt 파일을 확인 후, elk 서버와 동일한 위치로 이동한다.
[root@ELK_CLIENT ~]# ls -al /tmp/logstash-forwarder.crt
-rw-r--r--. 1 root root 1241 2016-10-05 12:50 /tmp/logstash-forwarder.crt
[root@ELK_CLIENT ~]# mkdir -p /etc/pki/tls/certs
[root@ELK_CLIENT ~]# cp /tmp/logstash-forwarder.crt /etc/pki/tls/certs/
* Install Filebeat Package
elk 서버로 로그를 전송할 filebeat 를 설치한다.
[root@ELK_CLIENT ~]# rpm --import http://packages.elastic.co/GPG-KEY-elasticsearch
[root@ELK_CLIENT ~]# echo '[beats]
name=Elastic Beats Repository
baseurl=https://packages.elastic.co/beats/yum/el/$basearch
enabled=1
gpgkey=https://packages.elastic.co/GPG-KEY-elasticsearch
gpgcheck=1
' | sudo tee /etc/yum.repos.d/elastic-beats.repo
[root@ELK_CLIENT ~]# yum -y install filebeat
* Configure Filebeat
filebeat 를 통해 로그를 전달하기 위해서 fileveat.yml 파일을 수정 한다.
이번 테스트에서는 /var/log/messages 파일을 전달하는 테스트를 진행 한다.
fileveat.yml 는 YAML 형식으로 문법에 있어 띄어쓰기나, 지시자가 엄격한 편이라 주석으로 설명 되어 있는 부분을 확인 하며 수정 한다.
[root@ELK_CLIENT ~]# vi /etc/filebeat/filebeat.yml
filebeat:
# List of prospectors to fetch data.
prospectors:
# Each - is a prospector. Below are the prospector specific configurations
-
# Paths that should be crawled and fetched. Glob based paths.
# To fetch all ".log" files from a specific level of subdirectories
# /var/log/*/*.log can be used.
# For each file found under this path, a harvester is started.
# Make sure not file is defined twice as this can lead to unexpected behaviour.
paths:
- /var/log/messages
# - /var/log/*.log
... 생략 ...
#document_type: log
document_type: syslog
..생략...
### Logstash as output
logstash:
# The Logstash hosts
hosts: ["1.234.42.101:5044"]
# Number of workers per Logstash host.
#worker: 1
# The maximum number of events to bulk into a single batch window. The
# default is 2048.
bulk_max_size: 1024
# Set gzip compression level.
#compression_level: 3
# Optional load balance the events between the Logstash hosts
#loadbalance: true
# Optional index name. The default index name depends on the each beat.
# For Packetbeat, the default is set to packetbeat, for Topbeat
# top topbeat and for Filebeat to filebeat.
#index: filebeat
# Optional TLS. By default is off.
tls:
# List of root certificates for HTTPS server verifications
#certificate_authorities: ["/etc/pki/root/ca.pem"]
certificate_authorities: ["/etc/pki/tls/certs/logstash-forwarder.crt"]
설정이 마무리 되면 filebeat 를 실행 하며
아래와 같이 인증서 오류일 경우 Logstash output 아이피 확인 및 서버간 시간 동기화를 확인 한다.
[root@ELK_CLIENT ~]# /etc/init.d/filebeat restart
2016/10/05 05:07:15.892751 transport.go:125: ERR SSL client failed to connect with: x509: certificate has expired or is not yet valid
Stopping filebeat: [ OK ]
Starting filebeat: 2016/10/05 05:07:16.085155 transport.go:125: ERR SSL client failed to connect with: x509: certificate has expired or is not yet valid
[ OK ]
## 정상적일 경우 아래와 같이 정상적으로 시작된다.
[root@ELK_CLIENT ~]# /etc/init.d/filebeat restart
Stopping filebeat: [ OK ]
Starting filebeat: [ OK ]
* Test Filebeat Installation
ELK 서버에서 로그가 들어 온다면 아래와 같이 elasticsearch 에서 확인 가능 하다.
[root@localhost ~]# curl -XGET 'http://localhost:9200/filebeat-*/_search?pretty'
{
"took" : 26,
"timed_out" : false,
"_shards" : {
"total" : 10,
"successful" : 10,
"failed" : 0
},
"hits" : {
"total" : 2058,
"max_score" : 1.0,
"hits" : [ {
"_index" : "filebeat-2016.10.05",
"_type" : "syslog",
"_id" : "AVj8AhrWp1FPNPPtYnbT",
"_score" : 1.0,
"_source" : {
"message" : "Oct 5 10:35:46 localhost kernel: Initializing cgroup subsys cpu",
dashboard 에서 nginx 인증시 설정한 아이디와 패스워드를 입력하여 진입한다.

정상적으로 로그인 될경우 아래와 같이 kibana dashboard로 진입 한다.

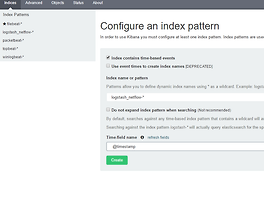
setting->filebeat-* 메뉴 진입후 중앙에 refresh 를 통해 pattern 을 refresh 하며 녹색 별모양을 클릭하여 default pattern 으로 등록한다.

discove 메뉴로 들어가서 정상적으로 로그가 수집 된 것을 확인 한다.

해당 로그별 자세한 상태를 클릭 할 경우 해당 로그의 정보를 확인 할 수 있다.

반응형
'System > Elastic Stack' 카테고리의 다른 글
| Logging every shell command to elastic stack (0) | 2018.05.20 |
|---|---|
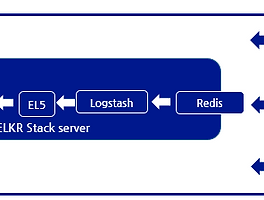
| Elasticsearch5, Logstash5, Kibana5 and Redis (ELKR5 Stack) install CentOS 7 (0) | 2016.12.24 |
| Elasticsearch5, Logstash5, and Kibana5 (ELK5 Stack) install CentOS 7 (10) | 2016.12.20 |
| netflow 데이터를 이용한 elk 설정 (3) | 2016.12.19 |
| logstash 패턴을 이용한 ELK 파싱(nginx access log,nginx access log + geoip) (0) | 2016.12.14 |