*netflow 데이터를 이용한 elk 설정
netflow 는 cisco 가 개발한 네트워크 프로토콜로 전통적인 snmp방식의 모니터링이 아닌 네트워크 상황분석을 위해 좀더 자세한 정보를
수집 분석 할 수 있도록 개발 되었다.
netflow를 통해 누가 트래픽을 시작해서 어느 목적지로 보냈는지, 또한 아래와 같이 패킷 샘플링 했을 때의 결과와 비슷한 정보를
수집 할 수 있다.
해당 페이지에서는 기존의 elk 가 세팅 되어 있는 환경에서 netflow데이터를 이용, elk 로 확인 하도록 한다.
elk 세팅 및 기존 정보 :http://cyuu.tistory.com/entry/Elasticsearch-Logstash-and-Kibana-ELK-Stack-install-CentOS-7
*사전 확인 부분
1)라우터(or L3) 장비에서 elk 서버로 netflow 세팅
2)ELK 서버 세팅
*netflow logstash 설정
아래와 같이 logstash-staticfile-netflow.conf 설정파일을 만든다
아래 내용중 input 지시자중 9995 포트로 netflow 데이터를 받는다는 의미로 기존의 라우터 혹은 L3장비에서 해당 elk 서버 9995 포트를 destination 으로 설정
해야 한다.
또한, 해당 출발지 ,도착지 아이피에 대한 geoip 연동을 위해 /etc/logstash/GeoLiteCity.dat 파일을 이용 filter 지시자에 해당 타겟 아이피에 대한
국가별 설정을 확인 한다.
output 지시자를 통하여 로컬 9200 포트를 사용 하는 eleasticsearch 로 전달 하며, 이때 index 를 logstash_netflow-%{+YYYY.MM.dd}" 형식으로
저장 하게 된다.
[root@localhost ~]# vi /etc/logstash/conf.d/logstash-staticfile-netflow.conf
input {
udp{
port => 9995
codec => netflow
type => netflow
}
}
filter {
geoip {
source => "[netflow][ipv4_src_addr]"
target => "src_geoip"
database => "/etc/logstash/GeoLiteCity.dat"
}
geoip {
source => "[netflow][ipv4_dst_addr]"
target => "dst_geoip"
database => "/etc/logstash/GeoLiteCity.dat"
}
}
output {
stdout { codec => rubydebug }
elasticsearch {
hosts => ["localhost:9200"]
sniffing => true
manage_template => false
index => "logstash_netflow-%{+YYYY.MM.dd}"
document_type => "netflow"
}
}
logstash configtest 를 통하여 해당 설정파일의 유효성을 검사하며 정상적일 경우 아래와 같이 OK 를 출력 한다.
[root@localhost ~]# /opt/logstash/bin/logstash --configtest -f /etc/logstash/conf.d/logstash-staticfile-netflow.conf
Configuration OK
logstash 를 재시작후 해당 index 에 대한 stat 를 확인 하면 아래와 같이 수집 되는 것을 확인 할 수 있다.
[root@localhost ~]# /etc/init.d/logstash restart
[root@localhost ~]# curl 'localhost:9200/logstash_netflow-2016.12.19/_stats'
{"_shards":{"total":10,"successful":5,"failed":0},"_all":{"primaries":{"docs":{"count":282277,"deleted":0},"store":{"size_in_bytes":141764007,"throttle_time_in_millis":0},"indexing":{"index_total":282468,"index_time_in_millis":255599,"index_current":0,"index_failed":0,"delete_total":0,"delete_time_in_millis":0,"delete_current":0,"noop_update_total":0,"is_throttled":false,"throttle_time_in_millis":0},"get":{"total":0,"time_in_millis":0,"exists_total":0,"exists_time_in_millis":0,"missing_total":0,"missing_time_in_millis":0,"current":0},"search":{"open_contexts":0,"query_total":250,"query_time_in_
... 생략 ...
아래와 같이 netflow 템플릿을 elasticsearch 에 put 한다.
[root@localhost ~]# curl -XPUT localhost:9200/_template/logstash_netflow -d '{
"template" : "logstash_netflow5-*",
"settings": {
"index.refresh_interval": "5s"
},
"mappings" : {
"_default_" : {
"_all" : {"enabled" : false},
"properties" : {
"@version": { "index": "analyzed", "type": "integer" },
"@timestamp": { "index": "analyzed", "type": "date" },
"netflow": {
"dynamic": true,
"type": "object",
"properties": {
"version": { "index": "analyzed", "type": "integer" },
"flow_seq_num": { "index": "not_analyzed", "type": "long" },
"engine_type": { "index": "not_analyzed", "type": "integer" },
"engine_id": { "index": "not_analyzed", "type": "integer" },
"sampling_algorithm": { "index": "not_analyzed", "type": "integer" },
"sampling_interval": { "index": "not_analyzed", "type": "integer" },
"flow_records": { "index": "not_analyzed", "type": "integer" },
"ipv4_src_addr": { "index": "analyzed", "type": "ip" },
"ipv4_dst_addr": { "index": "analyzed", "type": "ip" },
"ipv4_next_hop": { "index": "analyzed", "type": "ip" },
"input_snmp": { "index": "not_analyzed", "type": "long" },
"output_snmp": { "index": "not_analyzed", "type": "long" },
"in_pkts": { "index": "analyzed", "type": "long" },
"in_bytes": { "index": "analyzed", "type": "long" },
"first_switched": { "index": "not_analyzed", "type": "date" },
"last_switched": { "index": "not_analyzed", "type": "date" },
"l4_src_port": { "index": "analyzed", "type": "long" },
"l4_dst_port": { "index": "analyzed", "type": "long" },
"tcp_flags": { "index": "analyzed", "type": "integer" },
"protocol": { "index": "analyzed", "type": "integer" },
"src_tos": { "index": "analyzed", "type": "integer" },
"src_as": { "index": "analyzed", "type": "integer" },
"dst_as": { "index": "analyzed", "type": "integer" },
"src_mask": { "index": "analyzed", "type": "integer" },
"dst_mask": { "index": "analyzed", "type": "integer" }
}
}
}
}
}
}'
*kibana 설정
kibana 에서 logstash_netflow-* 로 해당 인덱스패턴을 아래와 같이 적용 생성 한다.

Discover 에서 logstash_netflow-* 로 확인시 아래와 같이 각 필드별로 netflow 정보를 확인 할 수 있다.

dashboad 적용도 확인 한다.

반응형
'System > Elastic Stack' 카테고리의 다른 글
| Logging every shell command to elastic stack (0) | 2018.05.20 |
|---|---|
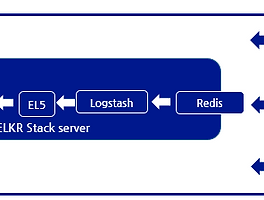
| Elasticsearch5, Logstash5, Kibana5 and Redis (ELKR5 Stack) install CentOS 7 (0) | 2016.12.24 |
| Elasticsearch5, Logstash5, and Kibana5 (ELK5 Stack) install CentOS 7 (10) | 2016.12.20 |
| logstash 패턴을 이용한 ELK 파싱(nginx access log,nginx access log + geoip) (0) | 2016.12.14 |
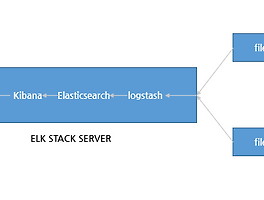
| Elasticsearch, Logstash, and Kibana (ELK Stack) install CentOS 7 (0) | 2016.12.14 |